
QUICK ANSWER
Las Vegas offers first-time investors a combination of no state income tax, a projected 6 percent vacancy rate, rent growth of 3 to 5 percent annually, and an accessible median entry price of $474,950 as of April 2026. The three strongest submarkets for first-time investors are Henderson (appreciation and occupancy), North Las Vegas (cash flow at lower entry points), and the southwest corridor including Enterprise and Spring Valley (newer inventory at accessible prices). Full operating model build before any offer is non-negotiable.
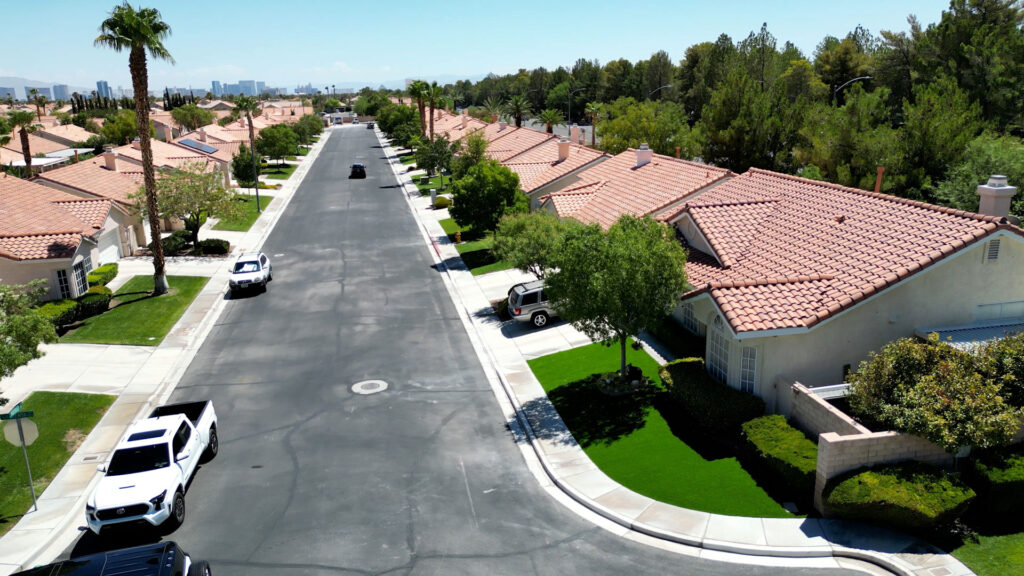
Las Vegas gets attention as an investment market for a short list of real reasons. Nevada has no state income tax, a protection built into the state constitution. The city draws steady in-migration from California and other high-cost states. And the median price point has historically remained accessible relative to other major Sun Belt markets.
Those are the headlines. What first-time investors actually need is a more granular picture: which submarkets to consider, what the numbers look like at the property level, and what they need to know before making an offer.
Why Las Vegas, and Why Now
Renter-occupied households account for 44 percent of Las Vegas housing, or approximately 108,244 households, creating a large and stable tenant pool. Vacancy is projected around 6 percent for 2026, with rent growth of 3 to 5 percent year-over-year. The metro median listing price was $474,950 in April 2026, which is the entry point for a market with consistent in-migration and a growing employment base.
The case against over-generalizing: Las Vegas is not one investment market. Neighborhood selection determines whether the numbers work. The same $450,000 budget produces a fundamentally different investment in Henderson’s Green Valley North versus North Las Vegas or the southwest corridor. Choosing a submarket based on a headline statistic rather than operating model analysis is how first-time investors get into trouble.
The Three Submarkets Worth Understanding First
Henderson. The $350,000 to $550,000 range in Henderson produces gross yields of 4 to 5 percent in corridors like Cadence, McCullough Hills, and Green Valley North. The March 2026 Henderson median sits at $500,000. Henderson’s investment case is built on occupancy and retention: vacancy often runs below 4 percent, and tenant tenure in communities like Green Valley and Seven Hills reduces the turnover costs that erode cash flow. The trade-off is entry price: you are paying for stability, which compresses yield at lower price points.
North Las Vegas. Lower entry price than Henderson or Summerlin, higher yields, more variability in tenant profile. North Las Vegas attracts investors building multi-property portfolios due to affordability and steady occupancy. The corridor is growing. The appreciation trajectory is less proven than Henderson’s. But for an investor prioritizing cash flow over appreciation in a first purchase, it is a defensible starting point.
Southwest corridor: Enterprise and Spring Valley. Newer construction at accessible prices. The southwest Las Vegas corridor has seen increased development and offers investors accessible entry points with lower near-term maintenance exposure than older inventory. The appreciation story is shorter. The employment proximity thesis (Harry Reid Airport, logistics corridors, entertainment employment) is the rental demand driver.
Looking for a submarket comparison before assessing properties?
Let’s talk budget, ROI, and timelines. Schedule a free call with us, so we can work on modeling what investment success looks like for you in this market, and where to direct your capital for maximum ROI potential.
What the Operating Model Needs to Include
Every Las Vegas investment property analysis requires five numbers beyond the purchase price and mortgage payment:
Property taxes. The Clark County median effective property tax rate is 0.79 percent of market value. The FY 2025–2026 rate is $3.2782 per $100 of assessed value applied to 35 percent of taxable value. On a $450,000 purchase, that is approximately $5,005 annually, or $417 per month.
HOA fees. Investment property assessed value increases are capped at 8 percent annually (compared to 3 percent for primary residences), and HOA fees vary from $50 to over $900 monthly depending on community. Both must be verified at the property level before building a projection.
Management fees. The Nevada average management fee is 8.57 percent of collected rent, with tenant placement at 77.1 percent of one month’s rent and lease renewal averaging $200.58.
Vacancy allowance. Model 6 to 8 percent as a conservative baseline.
Maintenance reserve. Budget 1 percent of purchase price annually for a first approximation; adjust based on property age and condition.
The Five-Step Path to a First Investment Property
Step one: Define your return goal. Cash flow, appreciation, or a combination. This determines which submarket and price tier to target before you look at a single listing.
Step two: Get pre-approved for financing. In Las Vegas’s competitive submarkets, submitting an offer without a financing letter is not competitive. Pre-approval is not a commitment; it is the documentation that makes you a credible buyer.
Step three: Run the full operating model before going under contract. Not after. The numbers that determine whether a deal works need to be in front of you before your earnest money is at risk.
Step four: Commission a proper inspection. For investment properties in particular, deferred maintenance items are operating cost assumptions that need to be verified before closing, not discovered after.
Step five: Have a property management plan in place at closing. Rental inventory in Las Vegas runs at approximately 1.5 months of supply as of 2026, which means vacant days are costly. Having a management relationship established before the property closes means the listing and screening process can begin immediately.
Let’s work together on creating your operating model
You let us know what your investment goals are, how much capital you need to achieve them, and let us help you create the operating model from there. Schedule a free call with us, so we can discuss your numbers and get a plan together.
Working With Plurify Properties
Plurify provides buyer and investor representation across Las Vegas, Henderson, Summerlin, and the southwest corridor.
For first-time investors, we start with the operating model: building the full cost picture for any property you are evaluating before any offer goes in. Every number is verified, not estimated.
Frequently Asked Questions
What return on investment can I realistically expect from a Las Vegas rental property?
Gross yields in the valley’s strongest investor submarkets run 4 to 5 percent in Henderson and slightly higher in North Las Vegas and the southwest corridor. Net yields after full expenses typically land 2 to 3 percentage points below gross, depending on HOA, management, and vacancy. First-time investors who expect net yields to match gross yields consistently underestimate operating costs. Management alone at the Nevada average of 8.57 percent of collected rent, combined with a 6 percent vacancy projection, accounts for roughly 14 to 15 percent of potential gross rent before taxes, insurance, HOA, or maintenance are included.
Which Las Vegas neighborhoods are best for a first investment property?
Gross yields in the valley’s strongest investor submarkets run 4 to 5 percent in Henderson and slightly higher in North Las Vegas and the southwest corridor. Net yields after full expenses typically land 2 to 3 percentage points below gross, depending on HOA, management, and vacancy. First-time investors who expect net yields to match gross yields consistently underestimate operating costs. Management alone at the Nevada average of 8.57 percent of collected rent, combined with a 6 percent vacancy projection, accounts for roughly 14 to 15 percent of potential gross rent before taxes, insurance, HOA, or maintenance are included.
Which Las Vegas neighborhoods are best for a first investment property?
The decision depends on whether your primary goal is cash flow or appreciation. For cash flow, North Las Vegas ZIP codes 89084 and 89032 and the southwest corridor (Enterprise, 89139) offer more favorable rent-to-price ratios at lower entry points. For appreciation, Henderson’s Green Valley North, Cadence, and Inspirada (ZIP codes 89002 and 89014) carry 30-plus years of documented appreciation and constrained supply. A first investment that prioritizes stability should lean Henderson; one that prioritizes yield should consider the southwest corridor or North Las Vegas, with honest underwriting of the shorter appreciation track record.
What does managing a Las Vegas investment property actually cost?
At the Nevada average, full-service property management runs 8.57 percent of collected rent for monthly management, 77.1 percent of one month’s rent for tenant placement, and $200.58 for lease renewal. On a $2,200 monthly rent, that is approximately $188 per month in management, $1,696 for placement (one-time), and $201 for each renewal. In year one with a new tenant, total management costs amount to approximately $4,153 on a fully occupied property. This needs to be in the operating model before any offer is made, not estimated later.
References
- CountryTaxCalc / Real702, “Nevada vs. California Taxes: How Much Will You Save? 2026,” countrytaxcalc.com, March 2026. Nevada: 0% state income tax, constitutionally protected. California top marginal rate: 13.3%.
- RentCafe Market Analysis / Yardi Matrix / U.S. Census Bureau, “Average Rent in Las Vegas, NV: 2026 Rent Prices by Neighborhood,” rentcafe.com, last updated April 22, 2026. Renter-occupied households: 108,244, or 44% of Las Vegas households.
- The Luxury Playbook, “Las Vegas Real Estate Market Overview & Forecast (2026 & Beyond),” theluxuryplaybook.com, April 2026. Vacancy projected around 6%; rent growth 3–5%; Henderson and Summerlin as leading appreciation submarkets.
- Federal Reserve Bank of St. Louis / Realtor.com, “Housing Inventory: Median Listing Price in Las Vegas-Henderson-Paradise, NV,” fred.stlouisfed.org. April 2026 median listing price: $474,950.
- Rice Real Estate & Property Management, “Las Vegas Rental Market Statistics 2026–2027,” ricelasvegas.com. Single-family rental inventory approximately 1.5 months of supply; tightening market signals.
- Nevada Real Estate Group, “Las Vegas Housing Market Forecast Summer 2026,” nevadarealestategroup.com. BLS CPI Rent of Primary Residence, Las Vegas-Henderson metro: +4.7% year-over-year, March 2026.
- Innovative Real Estate Strategies, “Las Vegas Rental Market Report 2026: What Landlords Need to Know,” iresvegas.com, March 6, 2026. Henderson submarket performance; North Las Vegas and Southwest Las Vegas market conditions.
- Innovative Real Estate Strategies, “Las Vegas Population Growth and Rental Demand 2026,” iresvegas.com, May 2026. Submarket in-migration patterns; Henderson and master-planned communities absorbing new residents.
- RECN Group, “Henderson NV Real Estate Market 2026,” recngroup.com, March 2026. Median Henderson home price near $530,000 in Q1 2026; $350K–$550K range pencils at 4–5% gross yield.
- Redfin, “Henderson, NV Housing Market: House Prices & Trends,” redfin.com. March 2026 Henderson median sale price: $500,000.
- Redfin, “Summerlin, Las Vegas Housing Market,” redfin.com. March 2026 Summerlin median sale price: $650,000. Zillow Home Value Index for Summerlin South: $712,766, up 2.2% year-over-year.
- Innovative Real Estate Strategies, “Best Las Vegas Neighborhoods for Rental Property Investment in 2026,” iresvegas.com. Summerlin cap rates typically 3.5–4.5% due to purchase price premium; appreciation play primary, cash flow secondary.
- Ownwell, “Las Vegas, Clark County, Nevada Property Taxes,” ownwell.com, April 2026. Clark County median effective property tax rate: 0.79% of market value.
- SmartAsset, “Nevada Property Tax Calculator,” smartasset.com. 35% assessed value ratio; 3% cap for primary residences; up to 8% cap for investment properties per Nevada Revised Statutes.
- Innovative Real Estate Strategies, “Finding the Right Property Management Company in Las Vegas,” iresvegas.com. HOA prevalence: approximately 28.6% of Nevada owned homes belong to HOAs; fees $50–$900+/month.
- iPropertyManagement.com, “Average Property Management Fees (2026): by Type & by State,” ipropertymanagement.com. Nevada average management fee: 8.57% of collected rent. Tenant placement: 77.1% of one month’s rent. Lease renewal: $200.58 average.
Legal Disclaimer: This article is informational and does not constitute legal, tax, or investment advice. Market conditions change. Mortgage rates and loan terms fluctuate; all figures cited reflect general market conditions as of May 2026. Consult a licensed Nevada real estate professional, attorney, and tax advisor before making investment decisions.